
Events Explorer 
The Events Explorer is a great way to get a quick overview of all events in Simple Analytics. It allows you to export data very quickly and only get the data you need. You can add columns and if a column has different values, it will group by those values. See add columns.
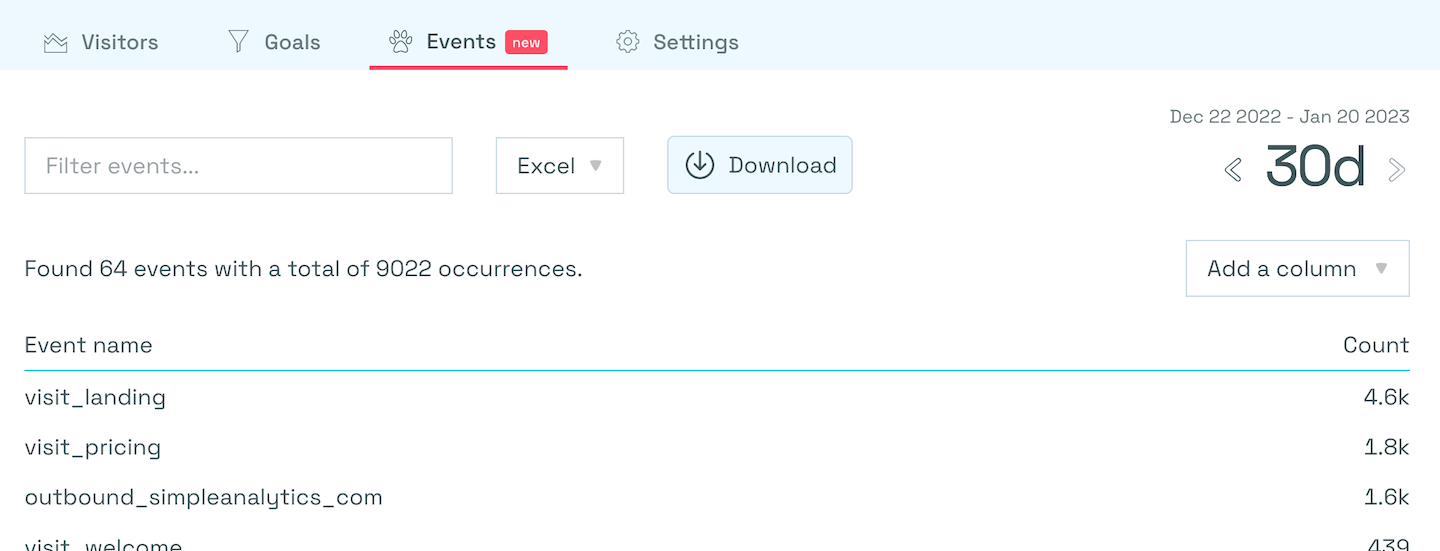
Overview of the Events Explorer in Simple Analytics
Search
You can search (or filter) all events by typing your search query. The fun part, it also includes the other column values when you search.
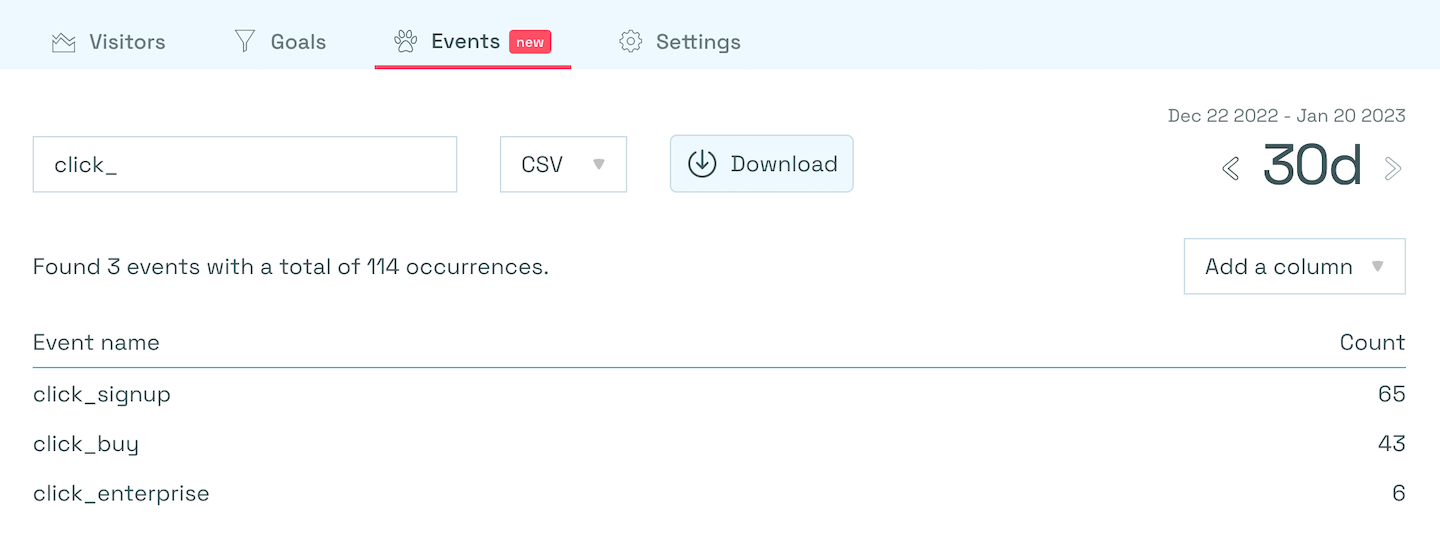
How to search in the Events Explorer of Simple Analytics
Add columns
You can add as many columns as you want. Do note that if a column has a lot of different values it will result in many rows. That’s why we disabled the date and some integer fields.
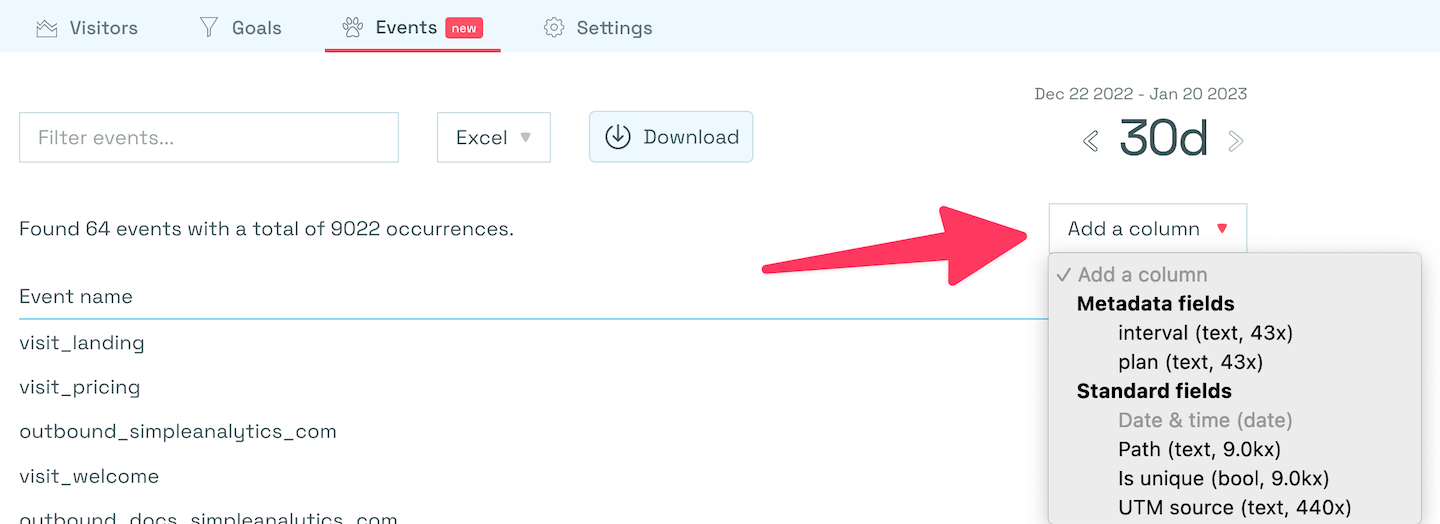
How to add a column with the Events Explorer in Simple Analytics
In our case we search for the buy event and added the plan metadata field. Now it shows us both values (starter, and business).
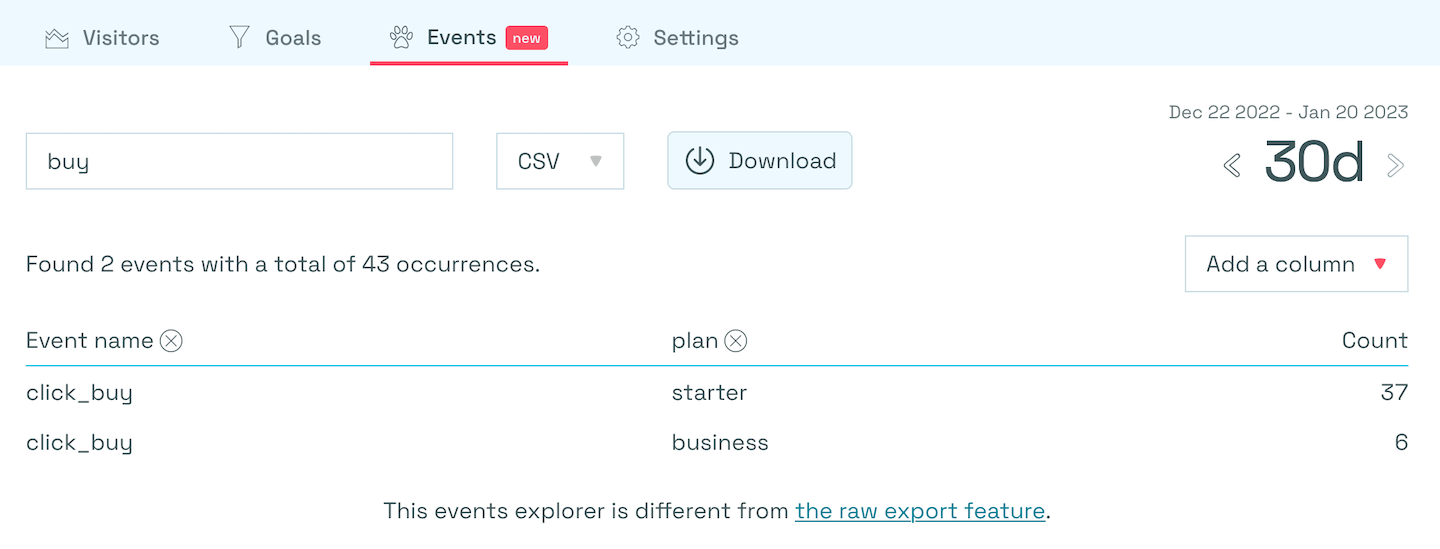
Use metadata in the Events Explorer of Goals at Simple Analytics
Export
You can easily export the data that you currently see to formats you probably love. Microsoft Excel, CSV, and Apple Numbers.
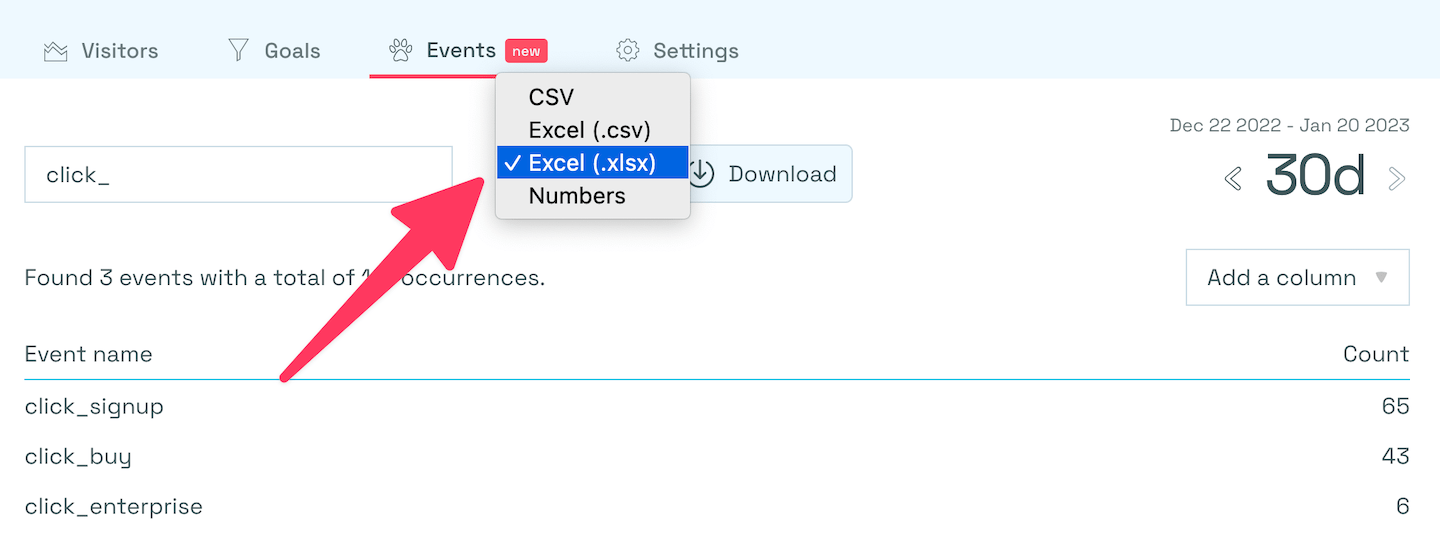
How to export to Excel with the Events Explorer in Simple Analytics