Trend lines 
Trend lines give you a quick overview of how your numbers are changing in the period shown in the charts.
Curved trend lines with outliers excluded
The default in Simple Analytics is to show these curved trend lines, excluding outliers. It gives a bit more information than linear instead of curved trend lines. Curved trend lines use a polynomial regression with an order of 2. It does not always play nice with outliers. To exclude them, we use an interquartile range (IQR) x 1.5.
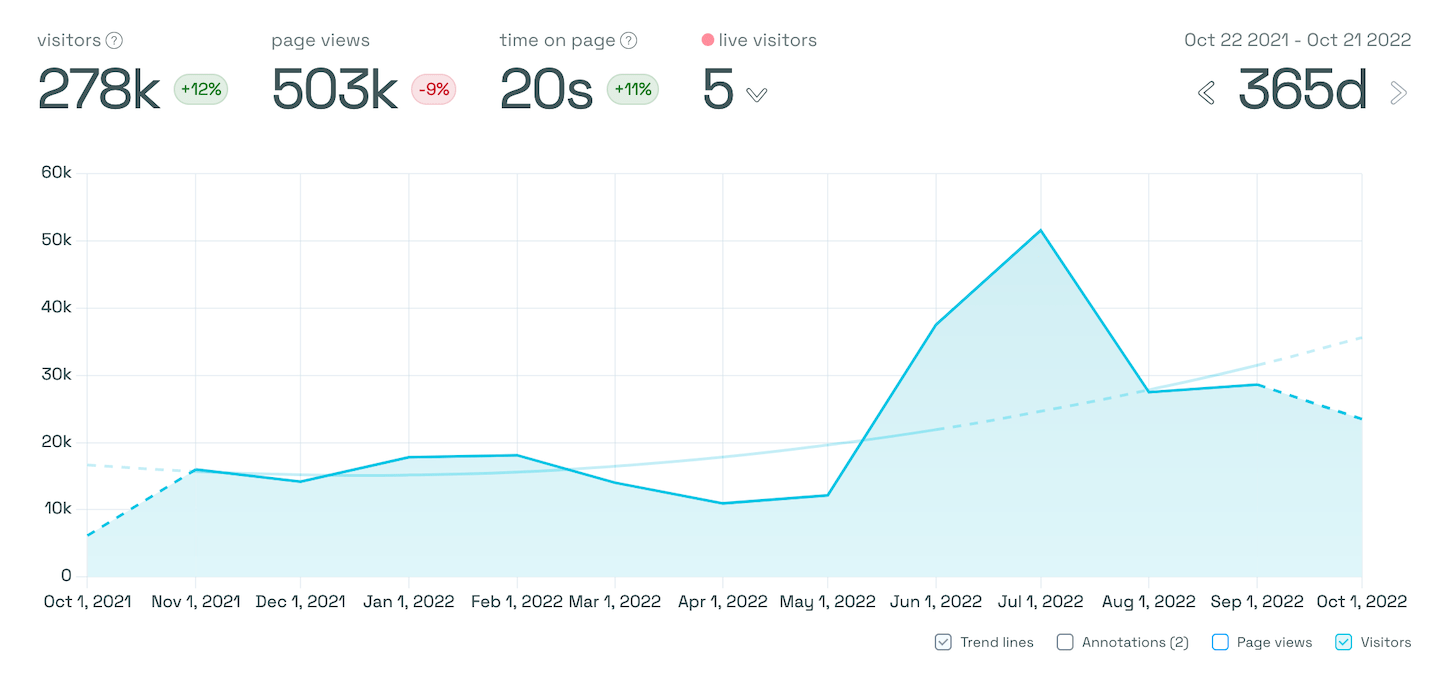
The dashed line shows which data is excluded. At the start and the end, the data is incomplete. We never include that data for the trend line. In the chart above, you see another dashed line; the month of July. That’s an excluded outlier. It will not be included in the trend line (unless you change this in your account settings).
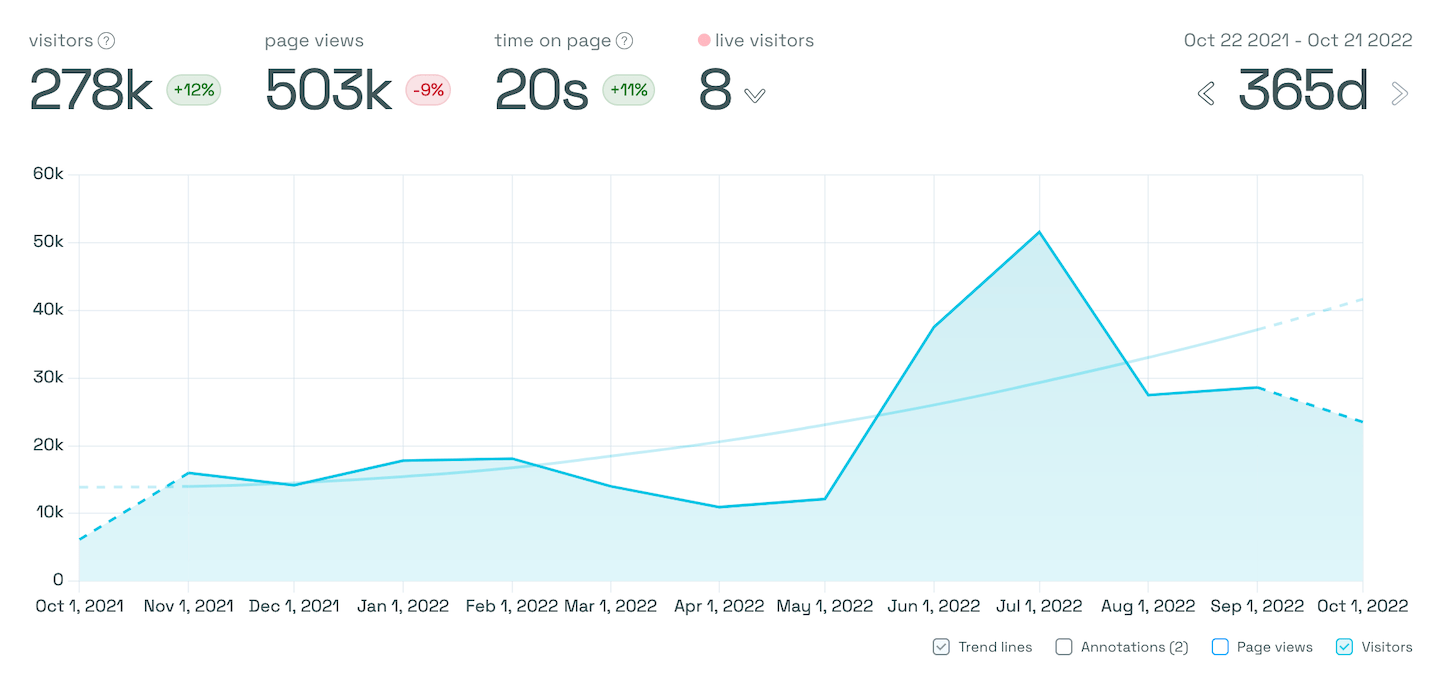
Curved trend lines with outliers included
Curved trend lines don’t always play nice with outliers. By default, we exclude them. If you include them, you see a trend line like this:
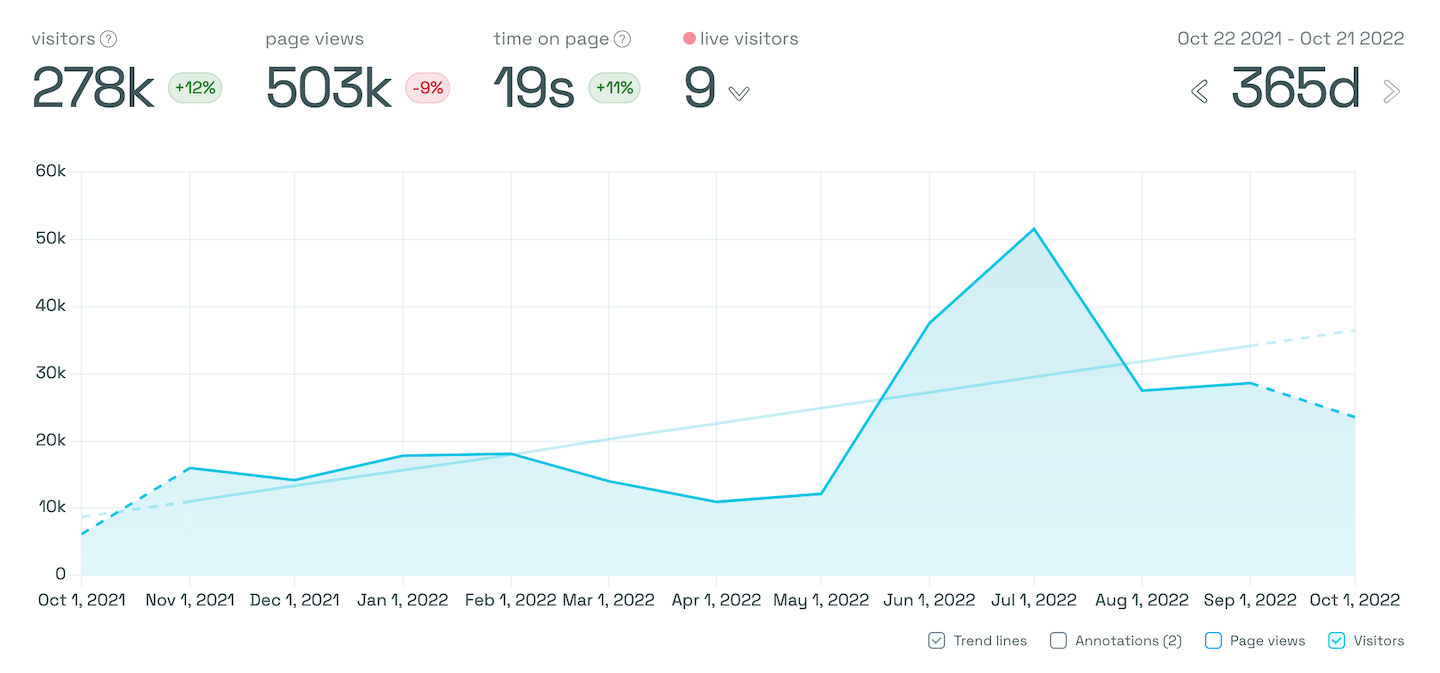
Linear trend lines with outliers included
The more basic trend line is linear. Just disable curved if you want to see these types of trend lines.
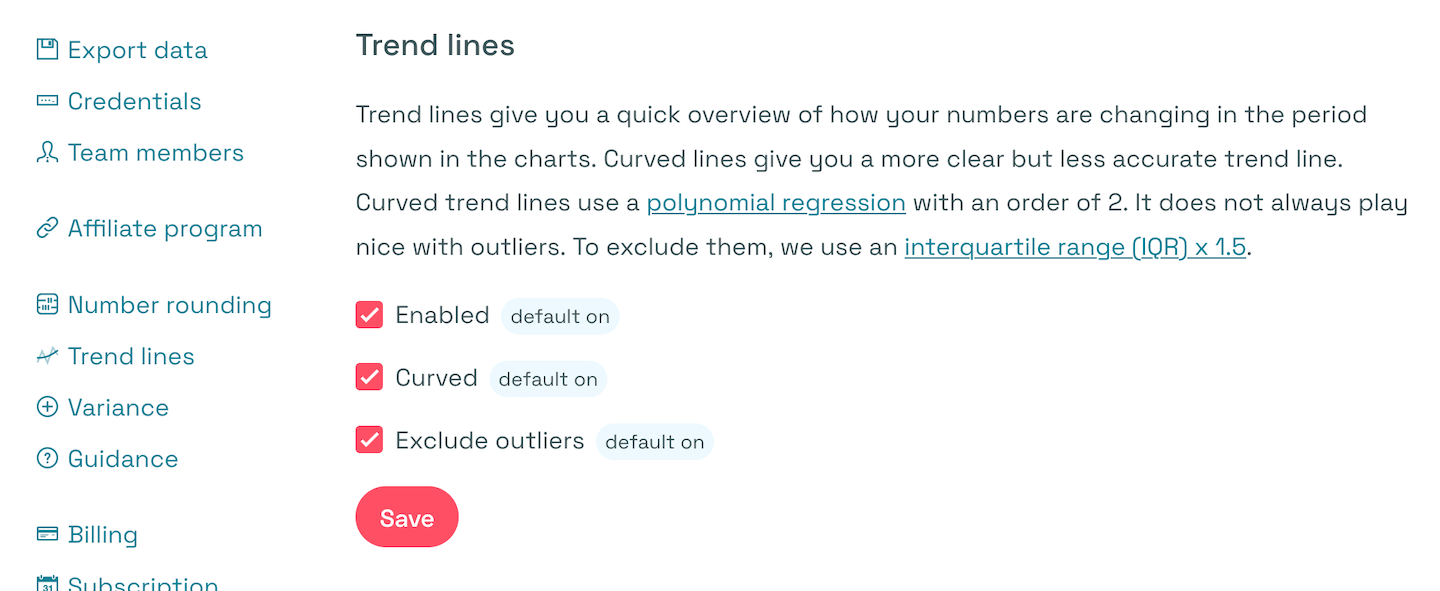
Account settings
In your account settings, you can change the settings of your trend lines.